Use the Message Queue tab to view details of system messages including:
System Dashboard - Queues and Services - Message Queue tab key fields
Queues sub-tab grid area fields
Use the Queues sub-tab to determine which system message queue is displayed in the Filters grid area.

Field |
Description |
|---|---|
Queue |
Type of system message queue. For example, Inbound Message Queue. |
New |
Number of new system messages. |
In Progress |
Number of in progress system messages. |
Error |
Number of error system messages. |
Complete |
Number of complete system messages. |
Total |
Total number of system messages. |
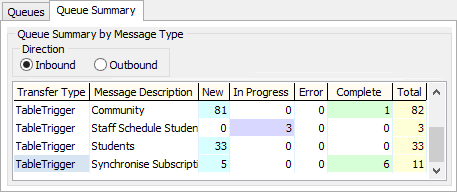
Queue Summary sub-tab fields
Use the Queue Summary sub-tab to determine which system message type is displayed in the Filters grid area.

Field |
Description |
|---|---|
Direction |
Select an option to filter the grid area based on the system message direction. You can select either:
|
Transfer Type |
Type of message transfer for the selected system message type. For example, TableTrigger. |
Message Description |
Description of the system message type. For example, Community. |
New |
Number of new system messages. |
In Progress |
Number of in progress system messages. |
Error |
Number of error system messages. |
Complete |
Number of complete system messages. |
Total |
Total number of system messages. |
Filters area fields
Use the Filters area to filter the system messages displayed in the Filters grid area.
.gif)
Field |
Description |
|---|---|
Transfer Type |
Filter based on the type of message transfer. |
Service Name |
Filter based on the name of the system service that created the message. |
New |
Select to display system messages with a status of New. |
Error |
Select to display system messages with a status of Error. |
In Progress |
Select to display system messages with a status of In Progress. |
Complete |
Select to display system messages with a status of Complete. |
Filters grid area fields
.gif)
Field |
Description |
|---|---|
Transfer Type |
Type of message transfer. For example, TableTrigger. |
Service Name |
Name of the service that created the system message. |
Status |
Status of the system message. |
Created |
Date the system message was created. |
Errors |
Number of errors. |
Details sub-tab fields
Use the Details sub-tab to view the values assigned to each field from the selected system message.
.gif)
Field |
Description |
|---|---|
Field Name |
Name of the field. |
Value |
Value of the field. |
Request XML sub-tab fields
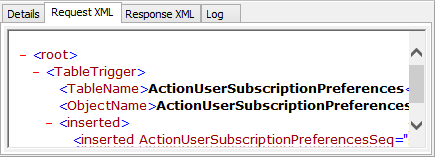
Use the Request XML sub-tab to view the request XML from the selected system message.

Response XML sub-tab fields
Use the Response XML sub-tab to view the response XML from the selected system message.

Log sub-tab grid area fields
Use the Log sub-tab to view log details for the selected system message.
.gif)
Field |
Description |
|---|---|
Batch Run |
Date and time of the batch run. |
Seq |
Unique identifier for the batch run. |
Log Type |
Type of log. |
Modified |
Date and time when the selected log was modified. |
Common fields and buttons
Fields
Field |
Description |
|---|---|
|
Indicates the outcome of the health check. You will see either:
|
Display For |
Display queued messages for the selected time period. |
Date/Time Range |
Select a date and time range for the health check. |
Time Resolution |
|
Last Refreshed |
Date and time that the message queues were last refreshed. |
Buttons
Button |
Description |
|---|---|
|
Refresh the message queues. |
Last modified: 31/08/2016 3:33:41 PM
|
See Also Viewing system queues and services data |
© 2017 Synergetic Management Systems. Published 20 July 2017.